5 things I learned building an email campaigns tool that scaled to 1/2 billion emails sent in ~1 year
This was a super fun, yet challenging project to work on. I’ve learned so much about scaling and performance along the way.
Last year I was tasked with building an email campaigns tool for our restaurant clients.
The campaigns tool allows clients to build emails in a Drag-n-Drop editor, choose a dynamic list of guests from a variety of sources to send the email to, schedule it for a specific date/time, as well as see detailed analytics after sending.
Why didn’t we just have our clients use Mailchimp?
Because a lot of restaurants get their guests from many sources – online reviews, email birthday lists, reservations, waitlist entries, wifi signups, etc. It’s very painful for them to constantly try to import their guests into a system like Mailchimp.
Our system automatically ingests guests and allows them to build up dynamic lists/segments of guests to send emails out to.
Since we launched the tool 15 months ago, the tool has seen 36% MoM growth, and clients have sent 550,000,000+ million emails through the product! 🚀🚀🚀
Architecture overview of the tool
It would take me a 30 page technical spec doc to describe the entire architecture of the tool because it’s pretty complex, but here is a basic overview.
The frontend is a multi-step editor flow built out in Vue.js. It allows guests to visually build, preview, schedule/send, and view analytics for their campaigns.
On the backend, we have all our guest data stored in elasticsearch, and restaurants build out custom lists or queries of quests they’d like to send too. For example, guests that spent > $200 / month that haven’t visited a location in 2 months that left a bad rating.
When the email is sent we run the query against the guest book, page through results from elasticsearch and throw the matching guests on a queue for processing by our campaigns service.
Our campaigns service pulls the messages/guests off the queue, removes any guests that share an email, and then sends the guests over to our email service for sending.
The actual email sending is powered by Sendgrid’s mail api, and the analytics for emails are powered by Sendgrid’s email webhooks which gives us per guests actions which we then store and report on in our system.
Their webhooks actions allow us to serve up analytics like:
Delivered rate
Click through rate
Click to open rate
etc.
This was a super fun, yet challenging project to work on.
Here are 5 major takeaways and things I learned while working on this project.
1. Scaling issues are hard
In the first 2 yrs of another email product we had, we sent 12 million emails.
In the first 4.5 months of our NEW email campaigns tool, we sent 25 million emails.
In the next 1.5 months, we sent another 26 million emails.
15 months after launch we are now sending ~90 million emails / month.
Scaling for this rapid product usage growth and adoption has been challenging.
Along the way we hit analytics recording issues, slow db queries, databases getting slammed with WalWriteLocks, needing to add auto-scaling K8s worker pods, and on and on.
Issue 1: Slow queries / poor data modeling
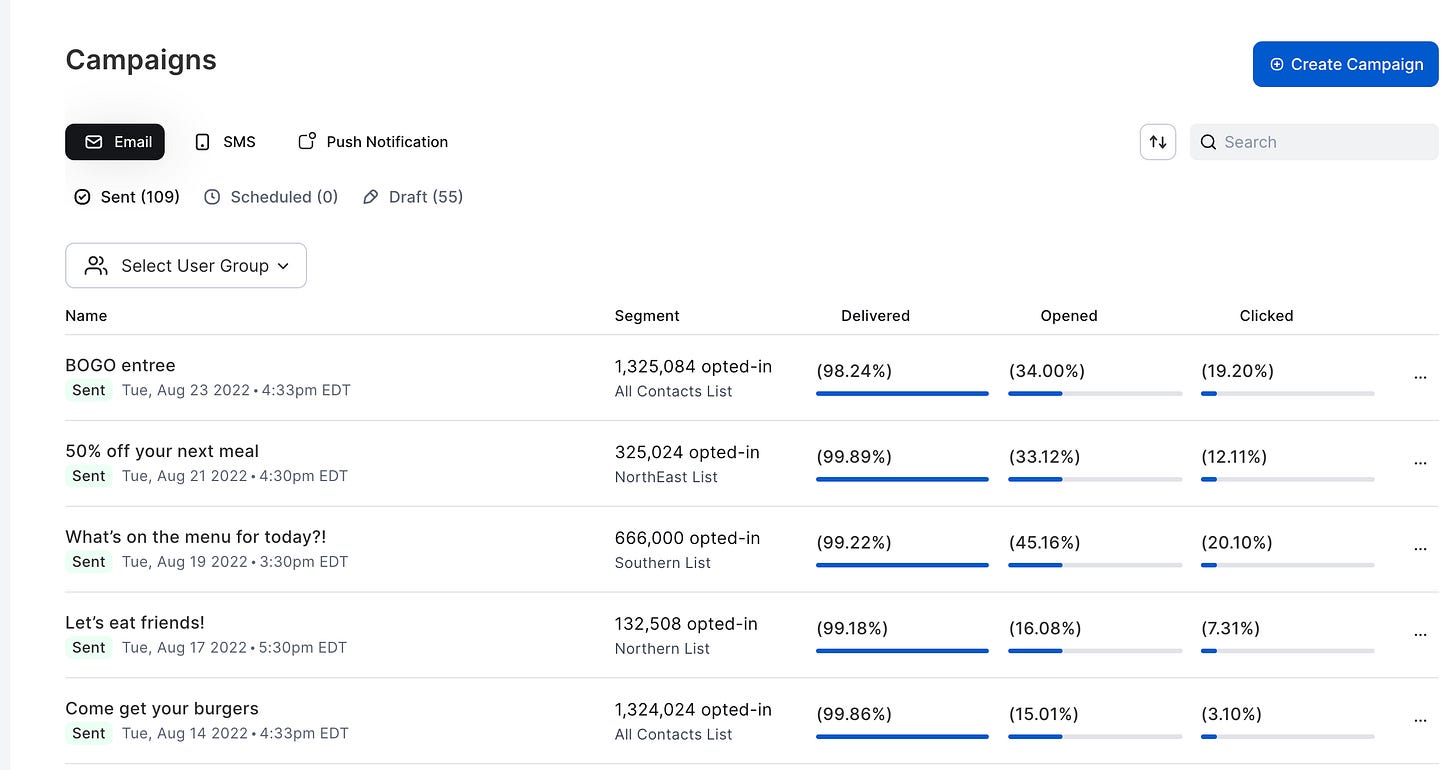
One of the first issues I ran into was serving up analytics for a list of campaigns we show to users.
Email marketers want to compare their analytics from campaign to campaign, so we needed a way to not only record which individual users got an email campaign, but also what the total delivered, clicked, opened, etc. percentages were for a list of campaigns.
Our initial solution was to just run a count query on our guest analytics table. That approach quickly bogged down as brands started sending campaigns to millions of guests.
You can see the query here, and how bad the performance was.
SELECT
	"campaign_id",
	COUNT("delivered_at") AS "_0",
	COUNT("opened_at") AS "_1",
	COUNT("clicked_at") AS "_2",
	COUNT("unsubscribed_at") AS "_3"
FROM
	"email_campaign_guest_history" AS "EmailCampaignGuestHistory"
WHERE
	"EmailCampaignGuestHistory"."campaign_id" IN(1, 2, 3, 4, 5)
GROUP BY
"campaign_id";We ended up breaking our analytics solution into two separate data reporting tables.
A table that recorded the analytics per guest so we could report on specific per-guest email activity
Another table that records counts for each event we received from sendgrid (delivered: 1,324,024, opened: 55,674 etc)
Now for showing analytics for a list of campaigns, we pull the pre-calculated counts from the new counts reporting table and calculate their percentages to display to users.
What was once a page with a query that timed out at 30 seconds, became a blazing fast query returning counts that completed in 330ms for hundreds of campaigns! 🚀


